Satellite remote sensing
Remote sensing is a process that detects features on the earth’s surface from a distance. Light from the sun reflects off the seafloor and is recorded by satellites. The satellites are thus able to image the world around us. This includes mapping of coastal habitats dominated by vegetation. We can see areas underwater like eelgrass and rockweed beds, and kelp forests. These maps influence decisions about conservation areas such as marine protected areas. They also help us manage the fisheries of commercially important seaweeds, including rockweed.
Dive DeeperTechnology Interview
What are “underwater forests”, and why are they important?
Underwater forests of seaweed and eelgrass surround our coast. These ecosystems provide habitat for many other species. They also store carbon, cycle nutrients, and protect the coast against erosion. In Nova Scotia and New Brunswick, rockweed (Ascophyllum nodosum) is the dominant seaweed in the intertidal zone. Wrack (Fucus species) can take over in wave-exposed areas. In the subtidal zone, eelgrass (Zostera marina) and kelps are the main habitat-forming species. These underwater forests perform a vast array of ecological roles. People even harvest some of them for commercial use. To understand and manage them, we need to produce maps.
What is shallow water satellite remote sensing?
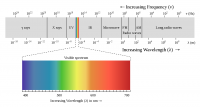
Shallow water remote sensing is a tool we can use to map coastal habitats. Sunlight or solar radiation is made up of a spectrum of different wavelengths. These range from ultraviolet (wavelengths of 290 to 380 nanometres), through visible light (wavelengths of 380 to 700 nanometres), to infrared (wavelengths of 700 nanometres to 1 millimetre). All surfaces and objects on Earth absorb, channel, or reflect this light. For example, many plants and seaweeds absorb red and blue light, but they reflect green and near-infrared light. Since we can’t see infrared light, it’s the reflected green light that makes them appear green to our eyes.
What is a spectral signature, how do we use this to make maps?
Each surface and object has a unique combination of absorption and reflection, and we call this its spectral signature. Areas with the same seabed habitat type have the same spectral signature because they reflect light in the same way. For instance, seaweed absorbs a lot of visible light (blue, green, and red wavelengths) while sand reflects it. So the amount of reflected light is much lower for seaweed habitat than for bare sand. We use satellites to measure the amount of light reflected from areas of seabed. From the spectral signatures, we can produce maps of seabed habitats.

The electromagnetic spectrum (Photo: Creative commons EM Spectrum by Philip Ronan licensed under Creative Commons Attribution-Share Alike 3.0.)
What problems are there with this technology?
Remote sensing in water is a more complicated process than remote sensing on land. On land, as light travels from the sun to the earth's surface, and then to the satellite, it only passes through the atmosphere. To image the seafloor, the sunlight must also pass through the sea surface and the water column before the satellite records it. This affects the speed, strength, and direction of the wavelength. Since this changes the spectral signature, we have to apply corrections to remove this effect. Then we can assign the signature to a habitat type. Scientists are researching better ways to do these corrections.
Are there limitations on what you can map?
In the crystal-clear blue waters of the Bahamas or the Mediterranean Sea, satellites can image the seafloor to depths of 40 metres. In Nova Scotia, the waters aren’t as clear and satellites can only image the seafloor to depths of around 10 metres. In the Bay of Fundy, the high levels of sediment (mud, sand, etc.) in the water reduce the water clarity even further. Here satellites can only measure the intertidal seafloor habitat at low tides.
How detailed is the information you can get from satellites?
Many different satellites orbiting the earth can image coastal zones. These vary in their spatial and spectral resolution. Spatial resolution refers to how much detail is visible in the image. We measure it as the area on the ground that corresponds to the size of one pixel in the image—the bigger the area, the lower the resolution. Spectral resolution refers to the number of unique wavelength ranges a satellite can measure.
Where do you get your satellite data from?
Two satellites that offer free data are the Landsat series and Sentinel-2. These image the same spot on the earth every 16 and 5 days, respectively. The Landsat series has been in operation since the 1980s. Its best spatial resolution is 30 metres. This means that one Landsat pixel corresponds to an area on the ground 30 metres long and 30 metres wide. Sentinel-2 has been in operation since 2015. It has a higher spatial resolution of 10 metres. Several commercial satellites provide much higher spatial resolution data (less than one metre for some). But you need to order and pay for imagery of your target area if you want to use these. I use free data from Sentinel-2 and pay for commercial Worldview-2 and Worldview-3 imagery.

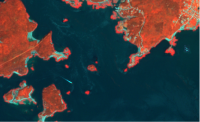
This image was taken by the Sentinel-2A satellite. It is a false-colour image. False-colour images use non-visible wavelengths as well as visible ones. Each wavelength is assigned a colour. In this case, infrared is shown as red, green as blue, and red as green. In this image, vegetation appears as red and we can see the seaweed beds much more clearly. (Photo: Copernicus Sentinel-2A (ESA) image courtesy of the European Space Agency – ESA (August 9,2020).)
How do you make maps of seaweed and eelgrass habitats?
To create habitat maps, I first need to survey, or groundtruth, the satellite data. We use a snorkeler, SCUBA diver, or boat with a drop camera to see what habitat is actually on the seabed at specific GPS coordinates. We use this to assign the spectral signatures from the satellite to habitat types on the ground.I t’s also used to test whether our predictions from the satellite data are correct.
How do you identify different habitat types?
To classify intertidal habitats, I can use the normalized difference vegetation index (NDVI). This is also used for land plants. The formula uses the amount of near-infrared and red light present to generate a value between -1 and +1. Healthier vegetation often has high NDVI values. But we can't use this for submerged habitats because the water affects the spectral signal. For these, we use the groundtruthing points to train a computer to create an algorithm (set of rules). It can then use this to recognize different habitats from their spectral signature. The habitat maps we develop support the monitoring and management of seaweed and eelgrass habitats in Nova Scotia.

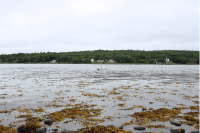
This snorkeller is seeing whether the predictions from the satellite data are correct. (Photo: Kristen Wilson)


